df <- tribble(~ bytes, ~ cm,
                47   ,   1.8,
                109  ,   2.0,
                218  ,   2.6,
                327  ,   3.1,
                436  ,   3.3,
                545  ,   3.5,
                654  ,   4.0)
gg <- ggplot(df, aes(x = bytes, y = cm)) +
geom_point() +
geom_smooth(method = 'lm') +
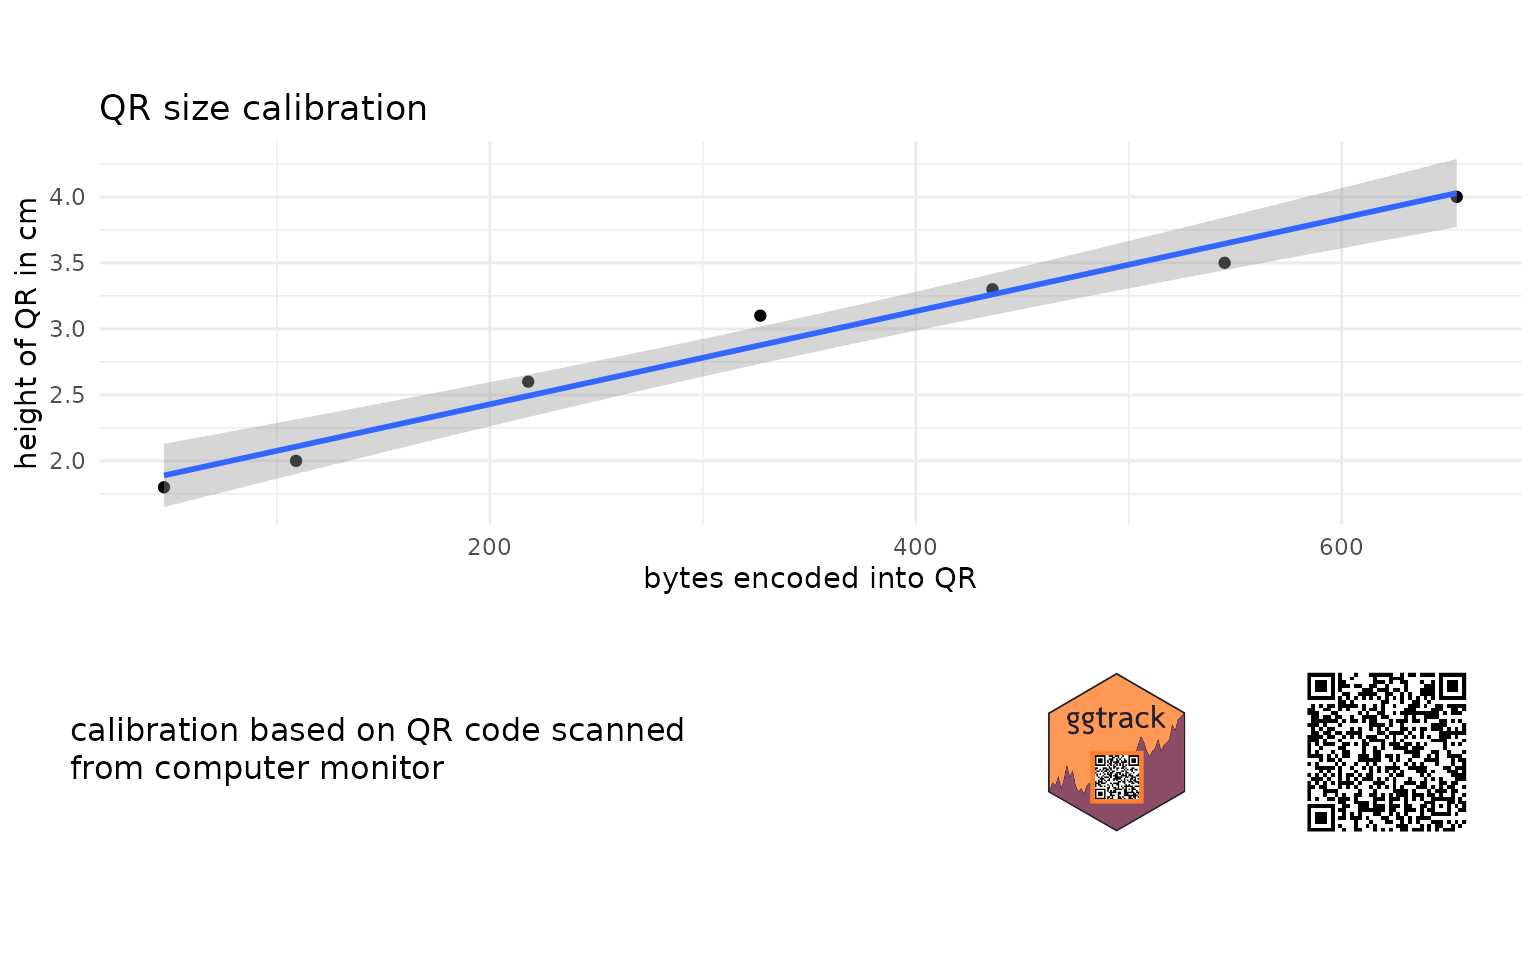
labs(x = 'bytes encoded into QR',
y = 'height of QR in cm',
title = 'QR size calibration') +
theme_minimal()
ggtrack(gg,
caption = 'calibration based on QR code scanned<br> from computer monitor',
qr_content = 'https://mrjoh3.github.io/ggtrack/articles/qr_calibrate.html',
logo = '../man/figures/ggtrack-logo.svg')
#> to encode this much text into QR making QR height 2.1cm
#> `geom_smooth()` using formula 'y ~ x'
qr_mod <- lm(cm ~ bytes, data = df)

summary(qr_mod)
#>
#> Call:
#> lm(formula = cm ~ bytes, data = df)
#>
#> Residuals:
#>        1        2        3        4        5        6        7
#> -0.08931 -0.10787  0.10790  0.22367  0.03944 -0.14480 -0.02903
#>
#> Coefficients:
#>              Estimate Std. Error t value Pr(>|t|)
#> (Intercept) 1.7236325  0.1032540   16.69 1.41e-05 ***
#> bytes       0.0035251  0.0002625   13.43 4.10e-05 ***
#> ---
#> Signif. codes:  0 '***' 0.001 '**' 0.01 '*' 0.05 '.' 0.1 ' ' 1
#>
#> Residual standard error: 0.1447 on 5 degrees of freedom
#> Multiple R-squared:  0.973,  Adjusted R-squared:  0.9676
#> F-statistic: 180.4 on 1 and 5 DF,  p-value: 4.096e-05
usethis::use_data(qr_mod, internal = FALSE, overwrite = TRUE)