Using ggtrack
To start you just need a ggplot and some text you wish to encode into the QR. The QR is intended to contain enough information to uniquely identify the report, so a URL, file name or other unique identifier. The QR encode process automatically appends a time stamp. But try to keep the content of the QR code minimal. The for information it is the more pixels its requires and the larger it needs to be. The examples here need a QR code size of 1.8cm to be reliably scanned using a phone off the screen. QR code are encoded using the qrencoder package.
library(ggtrack)
library(ggplot2)
library(grid)

gg <- ggplot(mapping = aes(x = 1:10, y = rnorm(10))) +
  geom_bar(stat = 'identity') +
  theme_minimal()

ggtrack(gg,
        qr_content = 'Report ID: 2c9075a5-4d7e-47a5-8616-55dd88af3dc5')
Add a Logo
A logo can be added either from a local or remote source. For now only png and jpeg/jpg are supported.
ggtrack(gg,
        qr_content = 'text content here',
logo = 'https://www.r-project.org/logo/Rlogo.png')![]()
Add a Caption
Captions use the gridtext package. So you can use both HTML and markdown to style. Or if you prefer, create your own grob and pass that through instead.
g <- ggtrack(gg,
            qr_content = 'For all your image tracking needs: https://github.com/mrjoh3/ggtrack',
            logo = 'https://www.r-project.org/logo/Rlogo.png',
            caption = 'Lots of extra info, or a fancy <span style="color:blue">"grob"</span>.')

grid.draw(g)
Rearrange Banner Elements
The order and size of the banner elements can be easily rearranged via the order and positions variables. Each element is defined via a single letter code:
- Caption is C
- Logo is L
- QR code is Q
And the element order is defined by the order of these codes. For example, the default order code is CLQ.
Depending on the size of the content in each element and its relative order, it becomes necessary to adjust the position or size of the elements. Position defines in order the proportional size of each element. You need to provide three numbers indicating the percent size of the element. These proportions are then converted into xmin and xmax values in the banner.
ggtrack(gg,
        order = 'LCQ',
        positions = c(25, 55, 20),
        qr_content = 'For all your image tracking needs: https://github.com/mrjoh3/ggtrack',
        logo = 'https://www.r-project.org/logo/Rlogo.png',
        caption = 'Lots of extra info, or a fancy <span style="color:blue">"grob"</span>.',
        logo_justification = 0)
When rearranging the order of banner elements it may be necessary to also change the justification of the logo and QR elements. By default these are justified to the right, so if your logo moves to the left it will appear out of place.
Justification is set via logo_justification and qr_justification. Justification here is positional. You need to imagine each element in its own rectangle with a bottom dimension of 0 to 1. If you want the logo or QR code on the right of the rectangle set justification to 1, or 0 for left. These are the main options, but you can use any number between 0 and 1 for more granular control.
Add a download link
The tracking chart can also be saved and made available for download. You can do this manually with gplotly::ggsave() and a simple markdown link as below.
ggsave(g, filename = 'ggrack_simple_download.png')However, ggtracker also has a helper function to facilitate. Using make_download you can create either a download link or button. Unlike the markdown link which simply opens the file in the browser; make_download creates a proper download link. Note, in the example below it is necessary to specify both location to save the file and the download location. This is only necessary in this example due to the way pkgdown handles file locations. In most instances you only needs specify the save location. The button can also be styled by CSS.
dl <- make_download(g,
                    save_file = c('../man', 'figures', 'ggtrack_chart'),
                    download_file = c('../reference', 'figures', 'ggtrack_chart'),
                    type = 'button',
                    date = '',
                    render = FALSE)
Something to consider at this point, with a down load button it is possible to display a plot without the additional metadata. Then pass the tracker object to the download link or button for users. This is a simple way to maintain the aesthetics of your report but still include vital metadata.
Encode Additional Content Within Image
It is also possible to encode arbitrary text or an R object within knitr chunks of a report or within a downloaded file when using make_download. Using the stegasaur package knitr hook is the easiest way to include the code used to generate a plot (see stegasaur docs).
The stegasaur stenograph method is included here as a download option. Simply pass the text or R object you want encoded to the stenograph variable. Then to decode the content of the image use stegasaur::decode(). For this method to work the image must be saved in PNG format, this is the default for make_download.
dl_steg <- make_download(g,
                         link_text = 'download file with stenograph encoded',
                         save_file = c('../man', 'figures', 'ggtrack_steg_chart'),
                         download_file = c('../reference', 'figures', 'ggtrack_steg_chart'),
                         type = 'link',
                         date = '',
                         render = FALSE,
                         stenograph = rnorm(10))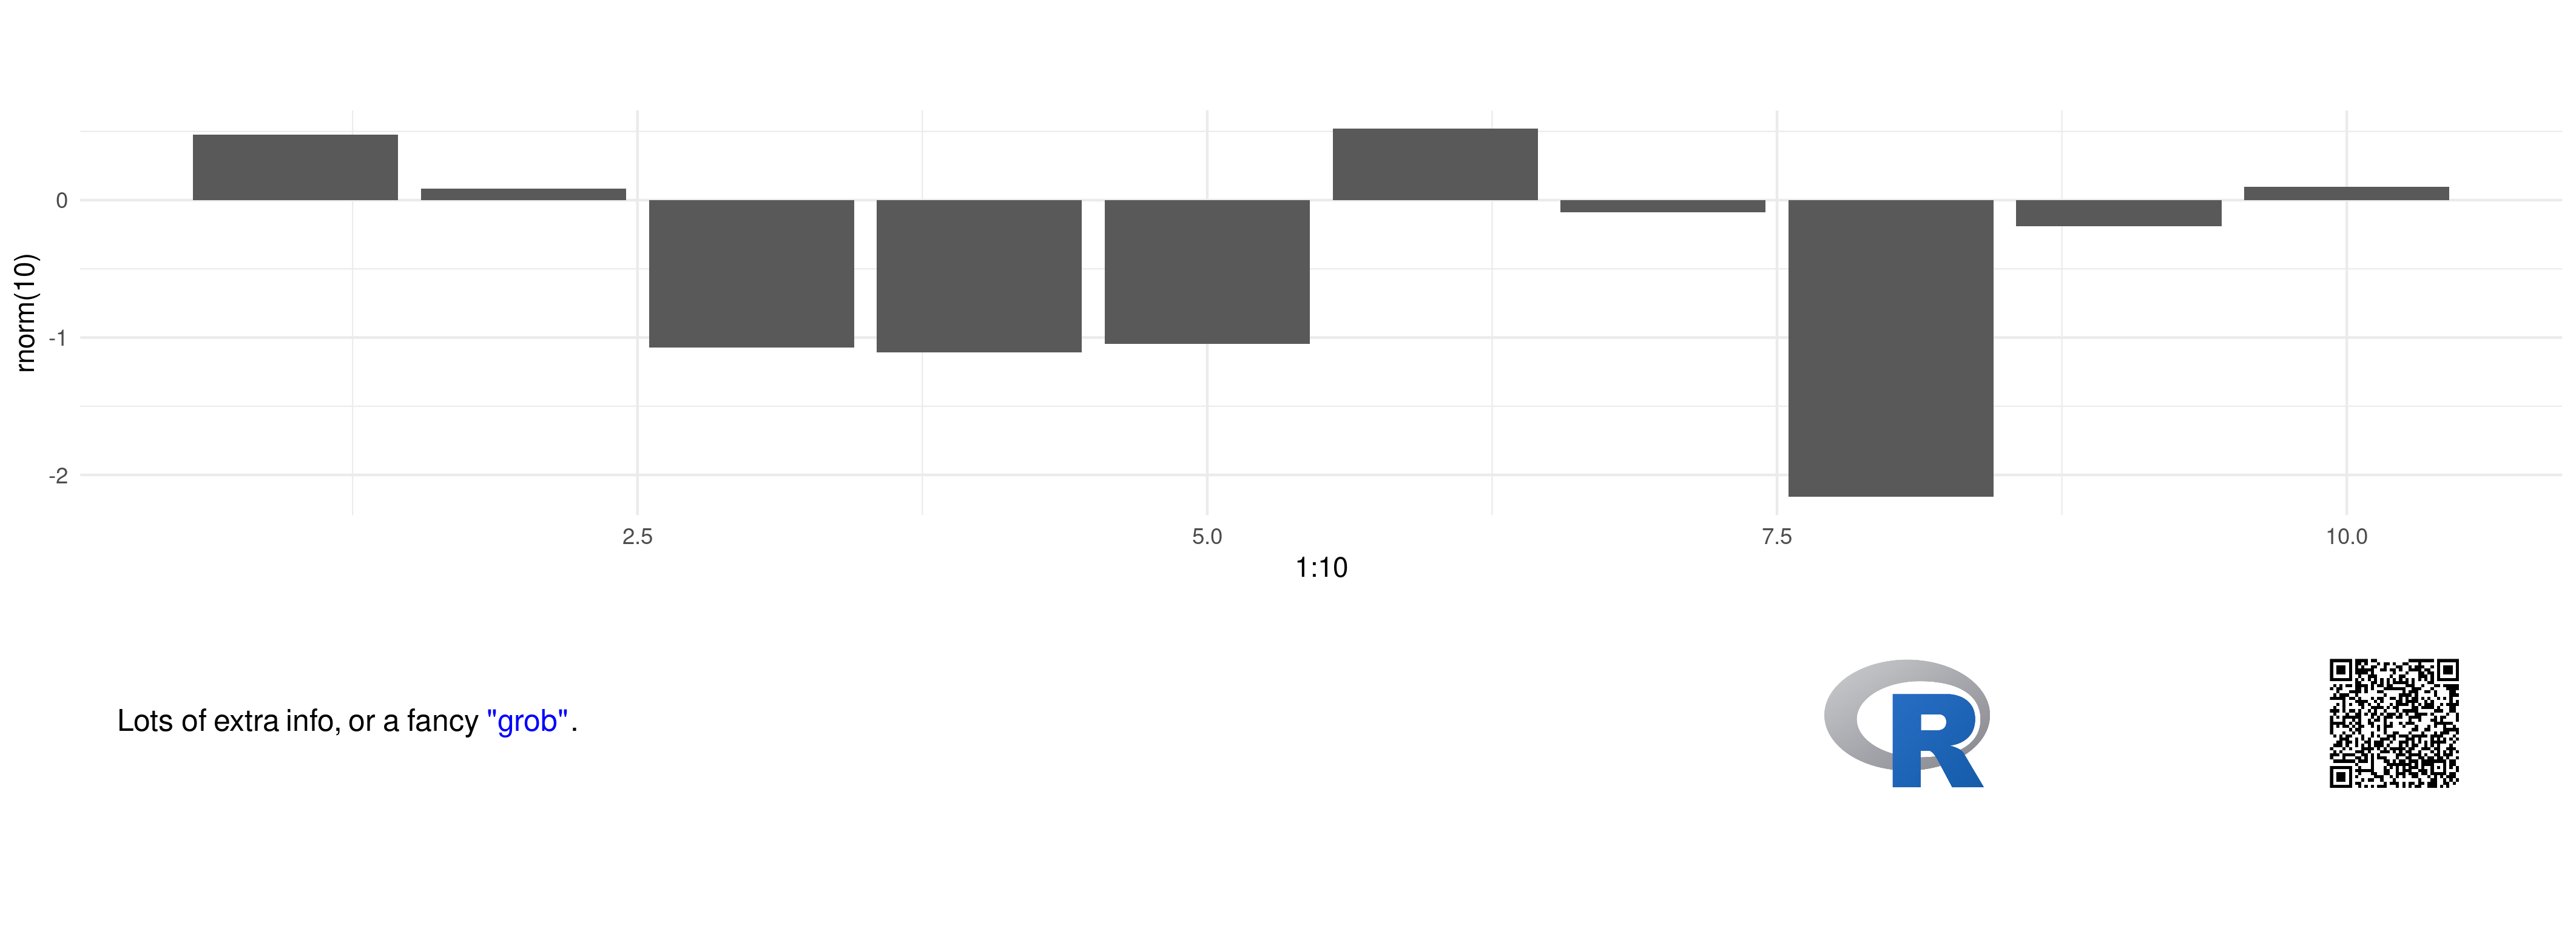
Tracking Banner Style
The tracking banner is a simple ggplot object. The tracking elements are grob objects added via annotation_custom. As a ggplot object the banner can also be styled in the same way. Any ggplot theme options are passed directly to the tracking banner theme. This enables you to match the tracker to your page theme or ggplot theme. For all available theme options see https://ggplot2.tidyverse.org/reference/theme.html.
library(rWBclimate)
library(ggthemes)

temperature <- get_historical_temp('aus', "year")

temperature_plot <- ggplot(temperature, aes(x = year, y = data)) +
  geom_path(color = 'blue') + geom_point(color = 'darkblue') +
  labs(title = 'Average Annual Temperature for Australia',
       y = 'degrees celcius') +
  stat_smooth(se = TRUE, colour = "darkred") +
  theme_fivethirtyeight()

for_QR <- paste0('Data accessed using R package: ',
                 'https://github.com/ropensci/rWBclimate / ',
                 'https://docs.ropensci.org/rWBclimate/')
for_Caption <- paste0('data accessed from the World Bank <br>',
                      'Climate Portal via the R package <br>',
                      '<span style="color:blue">rWBclimate</span>.')

ggtrack(temperature_plot,
        qr_content = for_QR,
        logo = '../man/figures/ggtrack-logo.svg',
        caption = for_Caption,
plot.background = element_rect(fill = "#f0f0f0", size = 0)) 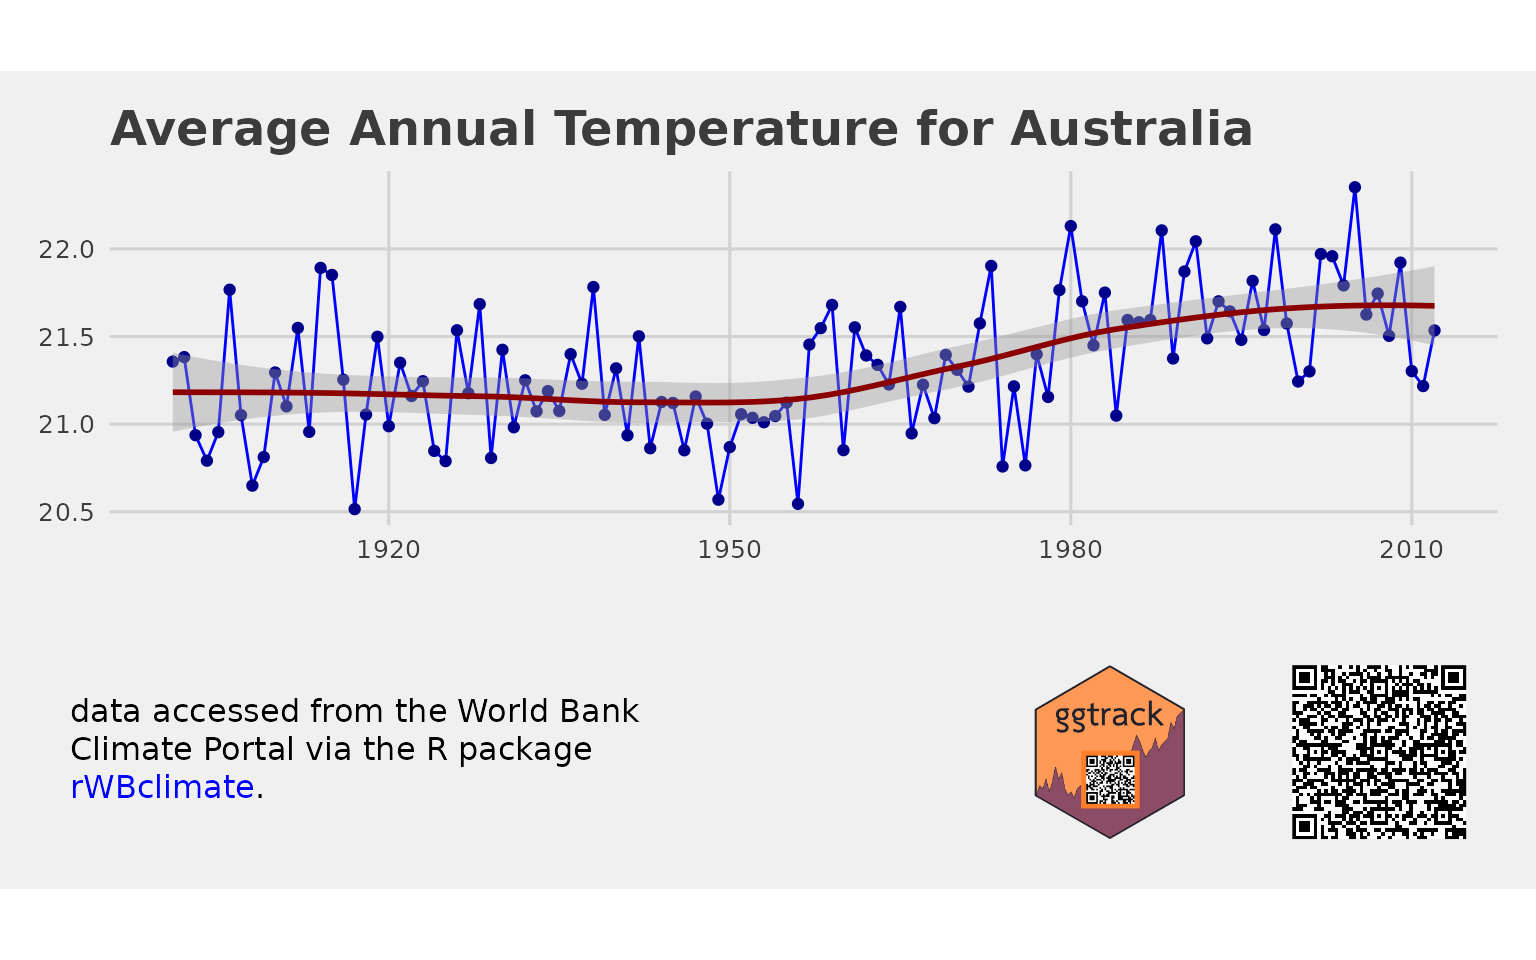
One Tracker Per Document
In some cases you may wish to create a single tracking banner and add it to multiple plots. ggtrack also has a more granular API that allows the user to iteratively build the banner. This banner can then be added to any existing plot.
track <- make_tracker() %>%
  add_logo('../man/figures/ggtrack-logo.svg', 1) %>%
  add_qr(for_QR, justification = 1) %>%
  add_caption(for_Caption) %>%
  add_theme(plot.background = element_rect(fill = "#ff9955", size = 0))

temperature_plot %>%
  add_banner(track)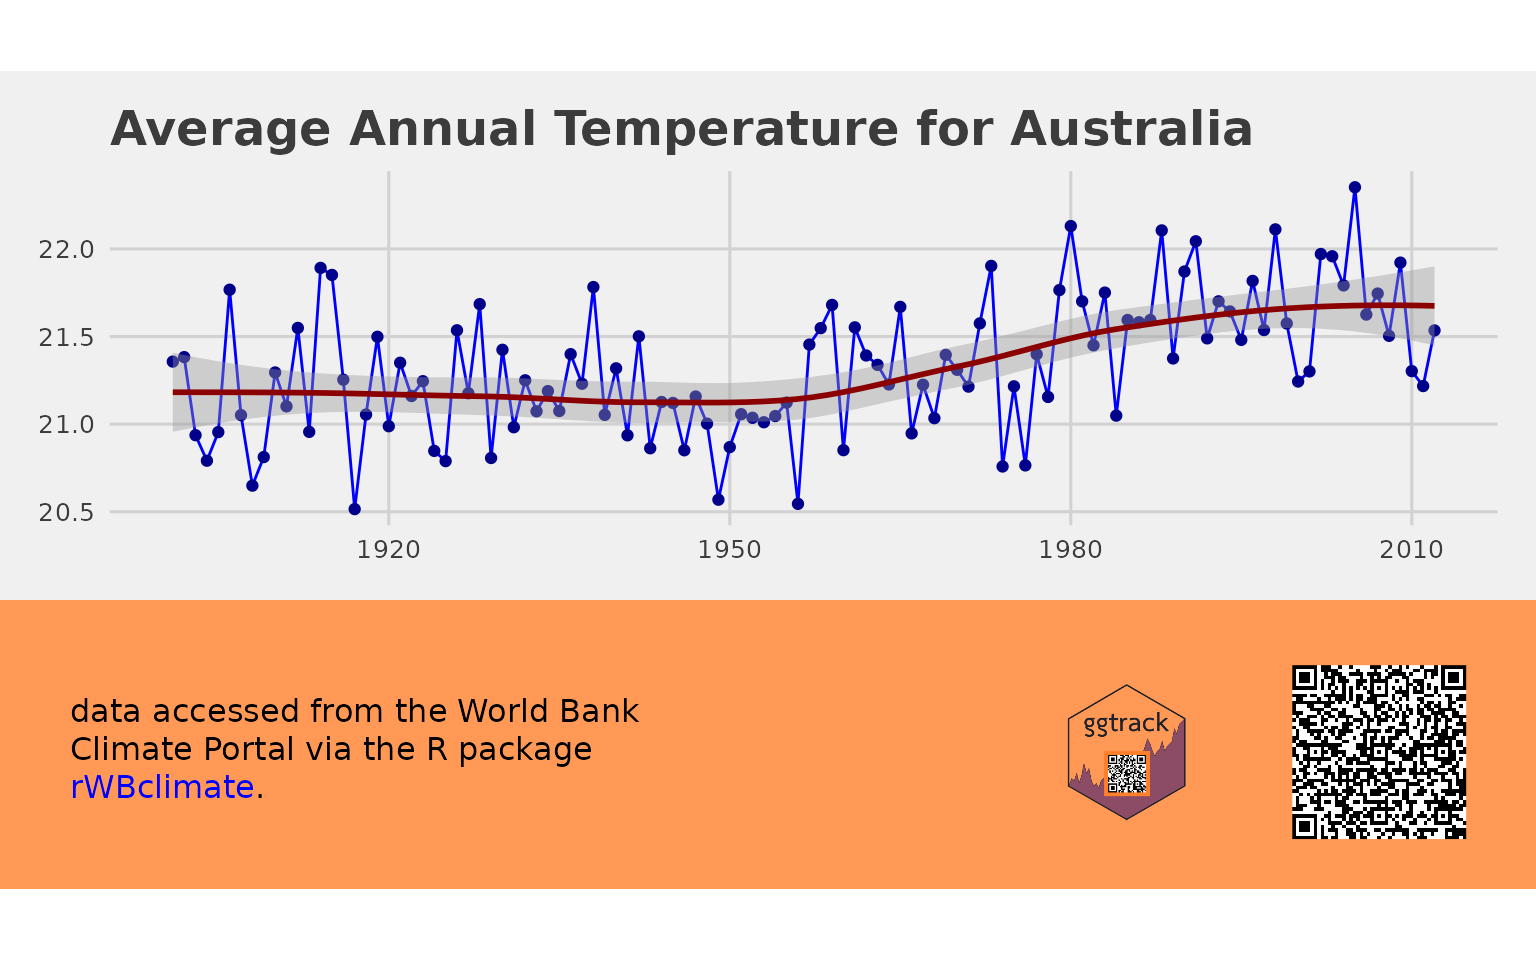
Retrieving Metadata
The metadata from the QR code can be read using the scanner on your phone. If you need to programatically extract this data use the quadrangle package. Given the way the QR code are generated, you will need to ensure you specify flop = TRUE. This essentially flips the image to replicate what a scanner looking at a screen would capture.
With quadrangle you can pass in the entire file or just the QR code. The package will detect the location of the QR code before decoding.
library(quadrangle)

qr <- qr_scan("../man/figures/ggtrack_chart_.png", flop = TRUE, plot = FALSE)

qr$values$value
#> [1] "For all your image tracking needs: https://github.com/mrjoh3/ggtrack https///github.com/mrjoh3/ggtrack ba52008d 20210710-085904"
And for a stegasaur encoded file, you can simply use stegasaur::decode.